Area Median Incomes Infographic
incomes compare internationally.
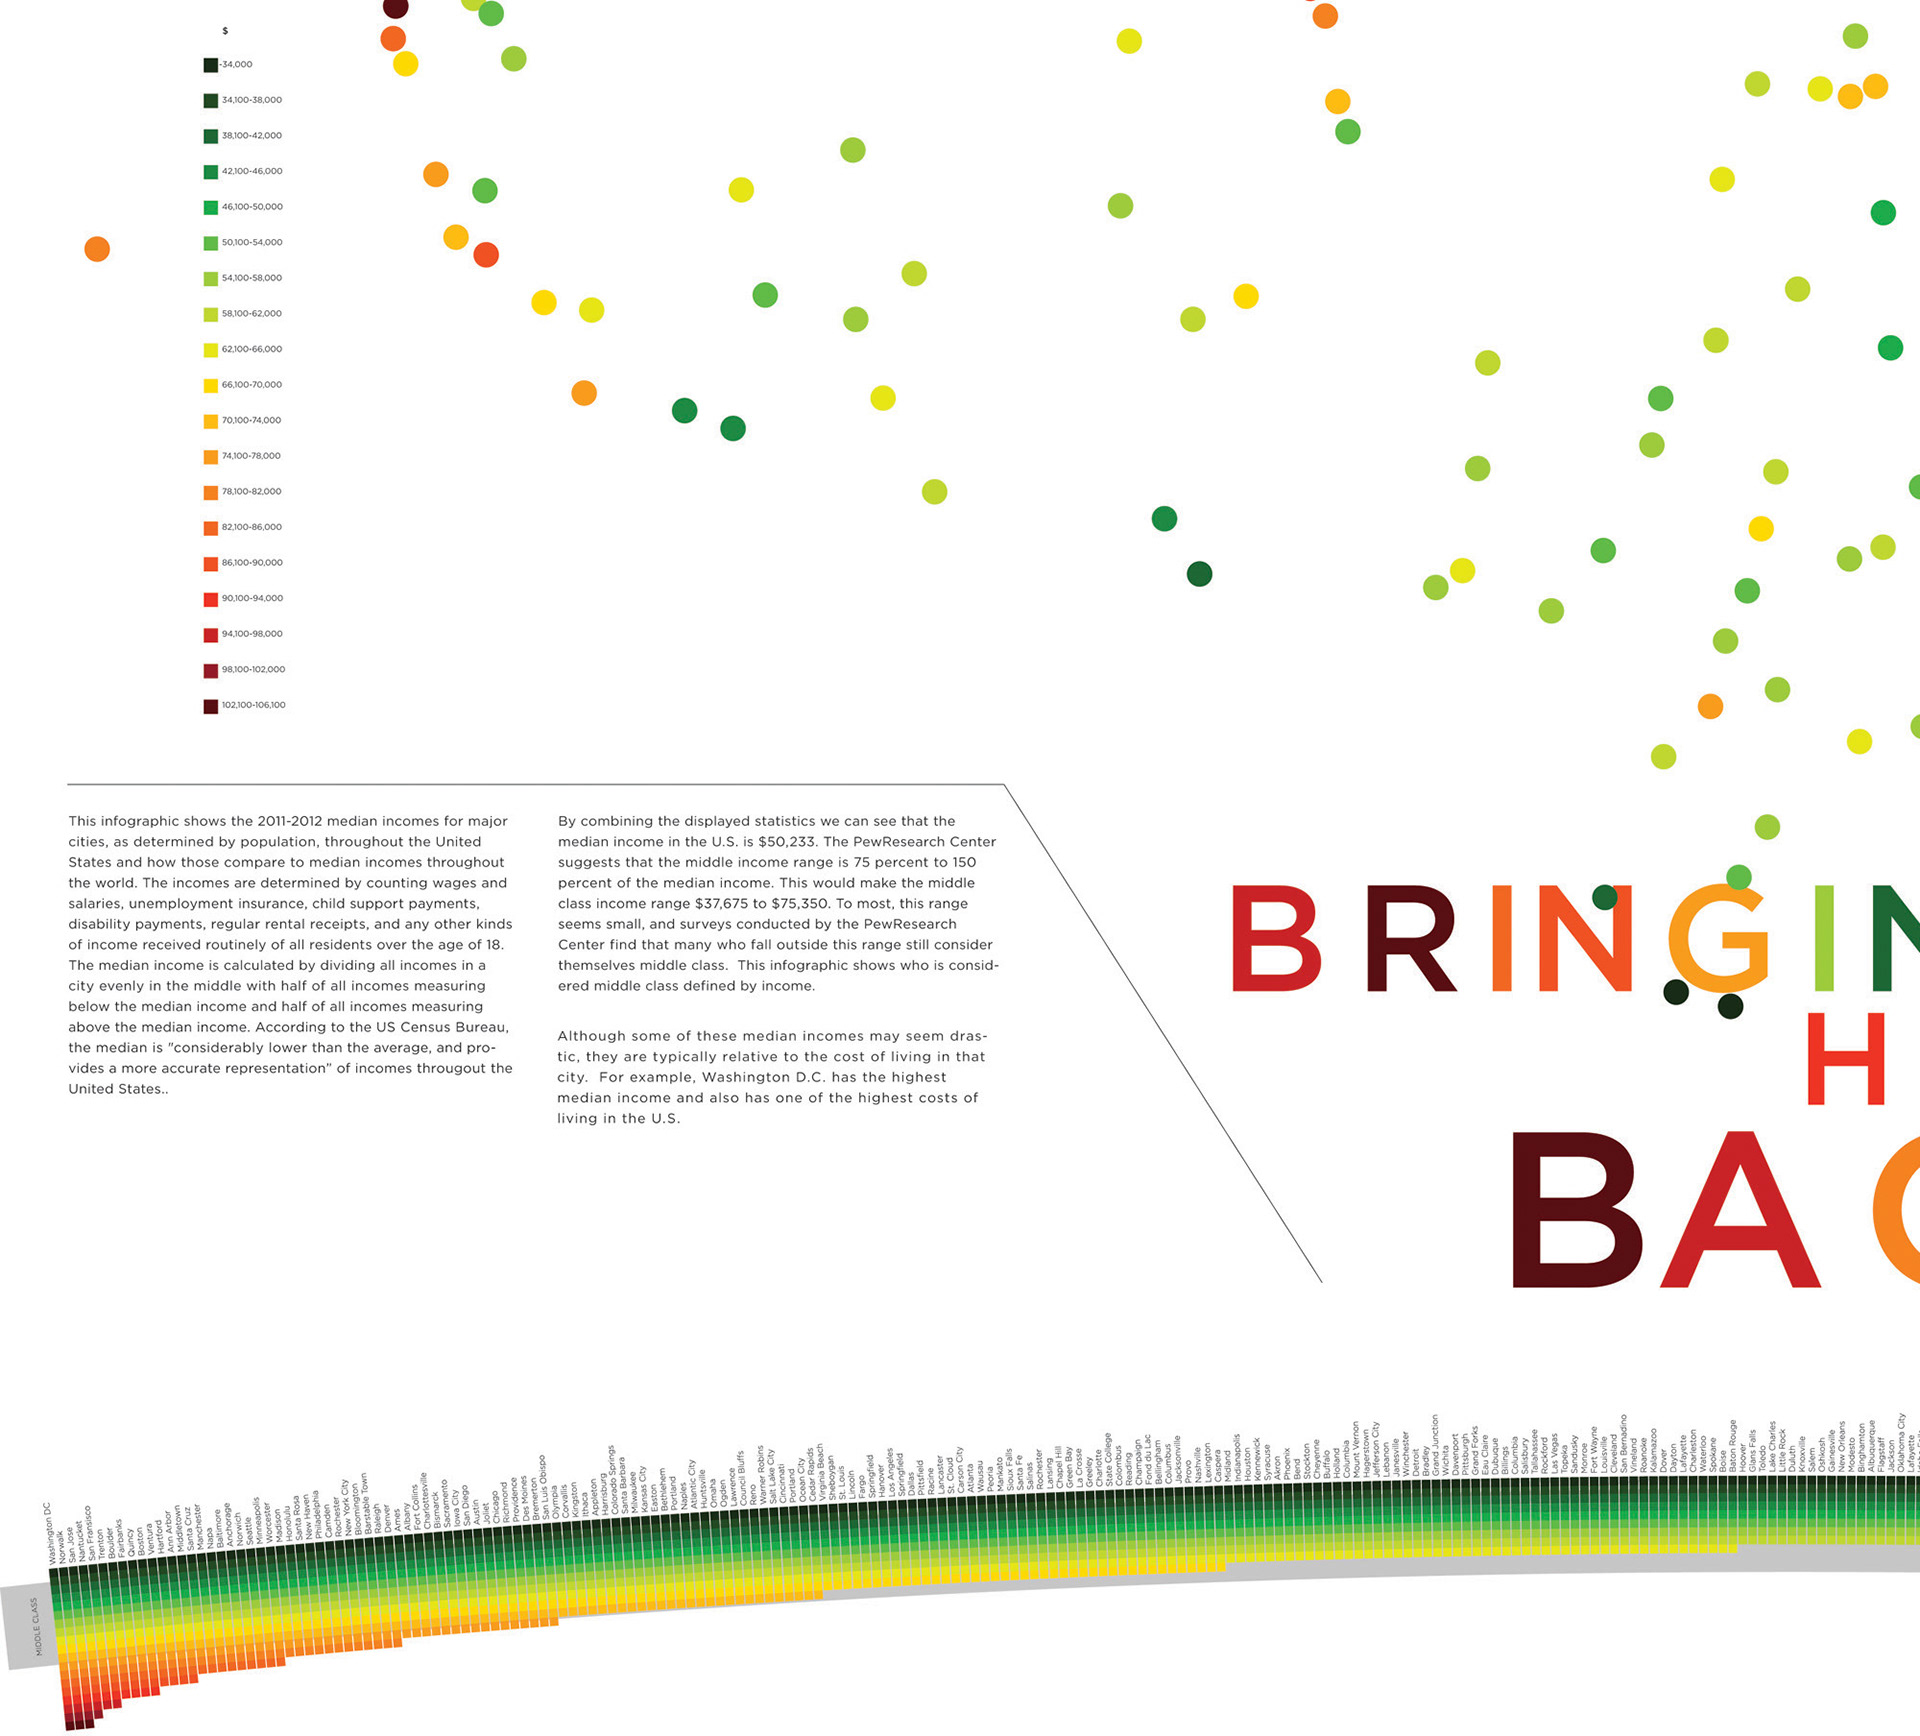
This infographic shows the 2011-2012 median incomes for major cities, as determined by population, throughout the United States and how those compare to median incomes throughout the world. The incomes are determined by counting wages and salaries, unemployment insurance, child support payments, disability payments, regular rental receipts, and any other kinds of income received routinely of all residents over the age of 18. The median income is calculated by dividing all incomes in a city evenly in the middle with half of all incomes measuring below the median income and half of all incomes measuring above the median income. According to the US Census Bureau, the median is "considerably lower than the average, and provides a more accurate representation” of incomes throughout the United States.
By combining the displayed statistics we can see that the median income in the U.S. is $50,233. The PewResearch Center suggests that the middle income range is 75 percent to 150 percent of the median income. This would make the middle class income range $37,675 to $75,350. To most, this range seems small, and surveys conducted by the PewResearch Center find that many who fall outside this range still consider themselves middle class. This infographic shows who is considered middle class defined by income.
The original print measure 46" x 38"